|
|
Broad Ripple Random Ripplings


The news from Broad Ripple
Brought to you by The Broad Ripple Gazette
(Delivering the news since 2004, every two weeks)

|
| Brought to you by: |

|

|
|

|

|

|
ISDH Dashboard for COVID-19 explained
posted: Apr. 09, 2020
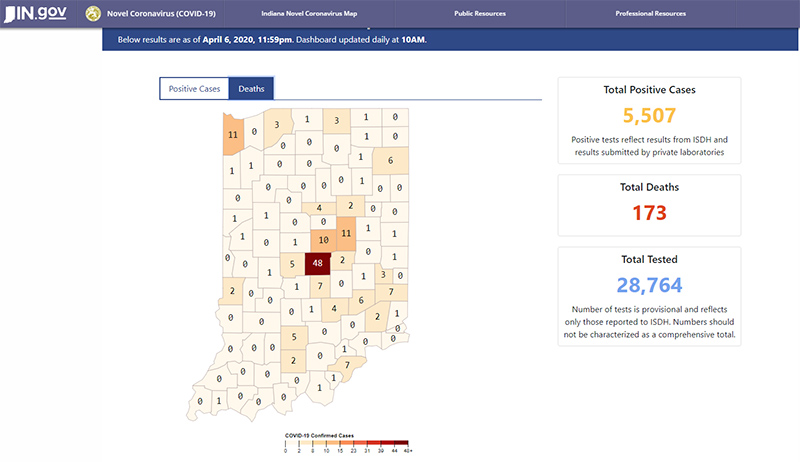
We have been tracking the COVID-19 data on the Indiana State Department of Health (ISDH) website's dashboard for weeks. We noticed a discrepancy in the daily data reporting vs. the historic graphs (the Total Deaths had increased on some days by as much as 34 new deaths in one day, while the historic graph shows the most deaths in one day to be only 20). Through a series of emails to the ISDH it was determined that the daily "Total Deaths" number in red that changes every day at 10am does not necessarily increase by the number of COVID-19 deaths that occurred in the last 24 hours. It actually increases by the number of deaths reported to the ISDH in the last 24 hours, not how many died in that period. Those reported deaths could have occurred several days before.
This means the number reported by most news outlets each day as that day's COVID-19 deaths (media typically quotes the increase in the red number on the dashboard for the day) is NOT the number of people who died that day from COVID-19, but how many deaths were turned into the ISDH on that day.
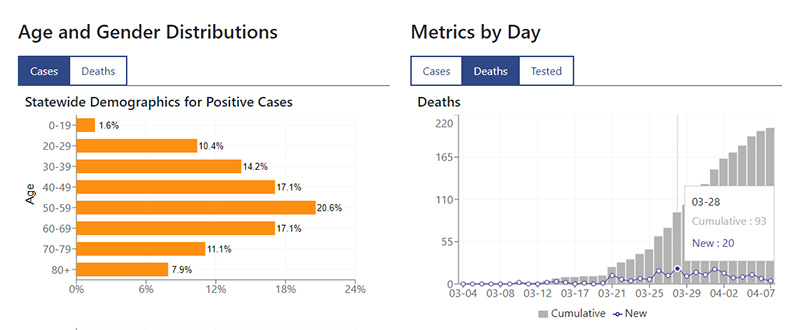
The best data to track the daily reported deaths is lower on the dashboard. Scroll down to "Metrics by Day" and click on the DEATHS tab. The data contained in this graph is the latest data, as deaths occurring several days earlier, but reported at a later date, will be reflected in this graph. The Metrics by Day graph may not be the exact number of deaths for each day in the past, but as the data continues to come to the ISDH, those past day's numbers are adjusted as needed and become for accurate.
The daily increase in the red number on the right can contain reported deaths from several days prior even though they appear to be all from today.
Clicking on the middle tab of the right graph shows the latest day-to-day numbers updated as past data is received.
| Brought to you by: |

|

|

|
|
|
|
|
| Brought to you by: |

|

|
|
| Brought to you by: |
|
|
|

|
| Brought to you by: |
|
||||
|
Copyrighted Property Of Broad Ripple Publishing
Site terms Broad Ripple Random Ripplings is hosted at Ionos.com |
||||

